Do You Really Know Where Your Products Are Being Sold?
Grey market leakage and unauthorized spot sales in your distribution network are silently eroding your profit margins. Track every product's journey with ZenTru and reclaim lost revenue.
Average revenue loss
Return on investment (ROI)
Anomaly detection time
Trusted Infrastructure & Standards



How Many of These Questions Can You Answer "Yes" To?
If you answered 'no' or 'not sure' to most of these, you may be experiencing invisible revenue loss in your distribution network.
Do you really know where your products are being sold?
Can you track which countries, dealers, and at what price the products you ship to distributors are actually being sold?
Are you aware of out-of-territory sales?
When a product sent to Region A shows up in Region B, do you have a system to detect it — or do you find out through customer complaints?
How much are spot sales eroding your profit margins?
Unauthorized spot sales undermine your pricing policy, erode trust among authorized dealers, and diminish your brand value.
Can you identify the source of grey market leakage?
Can you trace, down to the serial number, which distributor leaked products that surface in other markets through parallel imports?
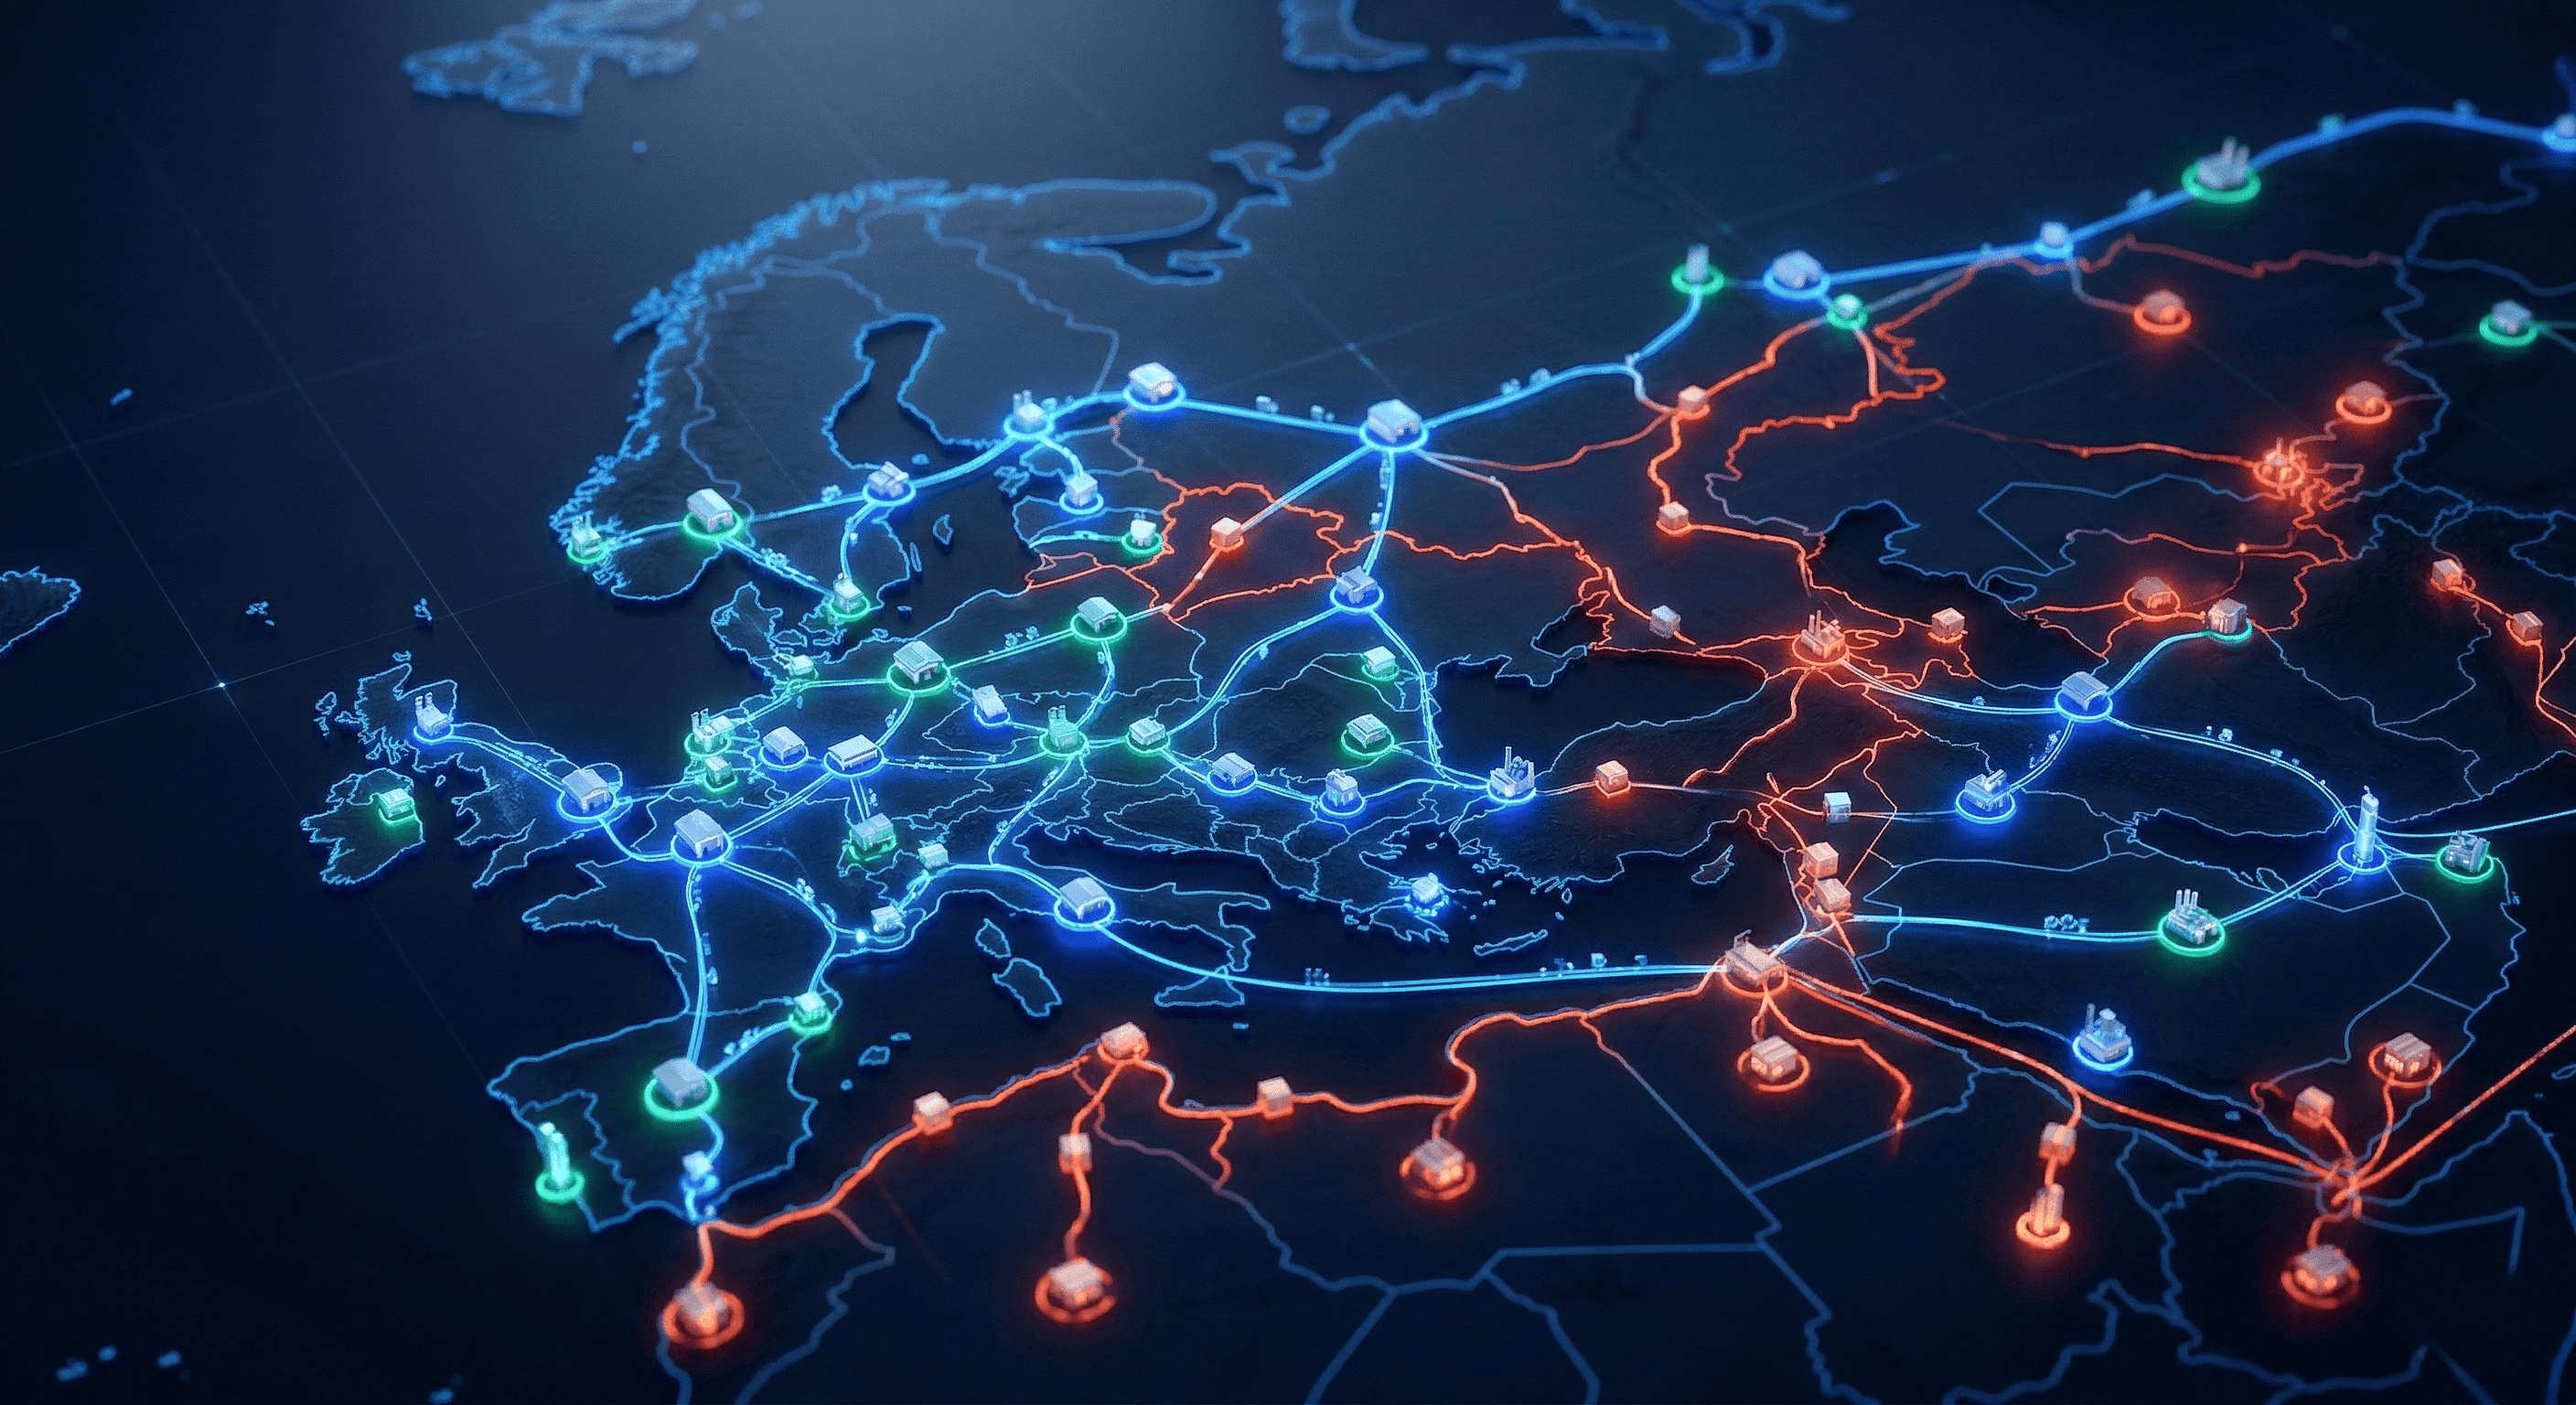
Grey Market and Spot Sales: The Silent Revenue Killer
Every grey market sale you don't catch is stolen directly from your bottom line. Here are the industry numbers.
Unauthorized Channel Sales
Distributors sell products outside contracted territories, disrupting pricing policies and reducing authorized dealers' profitability.
Grey Market Volume
The global grey market volume reaches $4.2 trillion annually. Every industry, every geography faces this threat.
Spot Sales Impact
Spot sales undercut your set retail price, causing price erosion and margin loss across the entire channel.
Delayed Response
With traditional methods, grey market violations typically surface months later through dealer complaints. By then, the damage has multiplied.
Full Control in Three Steps
Your customer scans the product, we collect the data, AI analyzes it. It's that simple.
Unique QR Coding
Every product is assigned a cryptographically unique, unclonable QR code. Integrates into your existing production line with zero downtime.
Customer Scans, Data Flows
When the end consumer scans the product, location, time, device, and channel data are collected automatically. User experience remains uninterrupted.
AI Analyzes, You Act
ZenTru's AI analyzes collected data and detects territory violations, spot sales, and grey market leakage within seconds.
Recoup 3x Your Investment in the First Year
ZenTru is not a cost — it's an investment. Every grey market violation you detect and every spot sale you prevent goes directly to your bottom line.
Frequently Asked Questions
Take Action
Stop your grey market losses today.
Discover how to eliminate revenue leakage in your distribution network with a free 30-minute strategy session.